To explore the functionality of the algorithm in the interpretation and functional diagnosis of selected clinical cases, select the option InfoPFT Demo -> Clinical Cases.
The screen will show the maximal flow-volume curves, demographic parameters and diagnosis of 70 clinical cases, which can be selected by clicking on the “View” button.
The new screen shows now the maximum flow curve, and below it a representation of the most characteristic forms of the inspiratory and expiratory loops, which must be selected manually by clicking on the corresponding box. In some cases two complementary curve types can be selected.
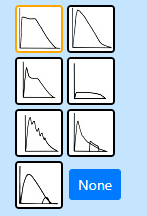
1: Truncated Peak Flow
2: Slow down MEF at low volume
3: Plateau preceeded by peak
4: Flat expiratory curve
5: Oscilations on the curve
6: FEF crosses tidal FV curve
7: No ERV
None (of this)

1: Flat inspiratory curve
2: Peak MIFVC near RV
3: Decreased MIF
4: Peak MIFV followed by plateau
5: Oscillations overlay the MIVFC
None (of this)
On the right, the most representative data of the exploration carried out are shown. Sometimes the examination is limited to spirometry with or without a bronchodilator test; other cases show more complete explorations that may also include lung volumes, lung CO diffusion test, airway resistance, inspiratory and expiratory maximal pressures, or arterial blood gases and acid-base balance.
It is possible to complete the data set by adding fictitious data, to observe how the interpretation modifies. It is not advisable to change the true data due to the risk of “freezing” the program. To enter data obtained externally, go to the “Manual Entry” option.
You can then select the language of the interpretation at the top right of the screen. The supported languages are English, Spanish, French, Catalan and Portuguese.
By pressing the “Generate Report” button a typical sheet with complete functional data, predicted average values, InfoPFT interpretation text and functional diagnosis are displayed.

Recent Comments