The Functional Diagnosis: Ventilatory Dysfunction Vector
by Pablo V. Romero MD , PhD
Functional diagnosis usually begins by identifying ventilatory dysfunction through forced spirometry. Forced spirometry is the simplest and most consolidated test of pulmonary function, and so it is very useful for an initial approximation to evaluation of the ventilatory status of the lung and respiratory system. Forced spirometry has three main parameters: Forced Vital Capacity (FVC), Forced Expiratory Volume in one second (FEV1) and the percent ratio between both (FEV1%FVC). FVC is the maximal volume that can be exhaled forcibly after a maximal deep inspiration; FEV1 is defined as the amount of gas that can be exhaled in one second after a maximal inspiration and during a maximal forced expiratory maneuver.
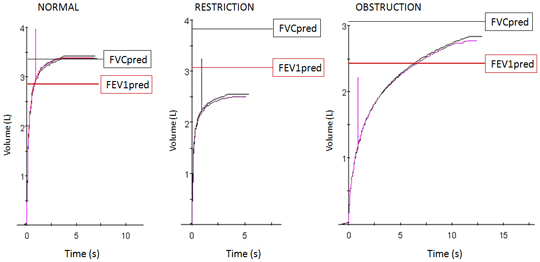
Figure 1: Examples of Normal, Restrictive and Obstructive maneuvers of forced maximal expiration. Vertical line indicates the first second after exhalation begins. Predicted values (mean) for FVC (black line) and FEV1
FEV1 is the parameter that best evaluates the global ventilatory disorder for several reasons:
- Because it decreases both in airways obstruction and in ventilatory restrictive defect, (see Figure). When both situations are present (mixed syndrome) the effects are additive on FEV1.
- Because it is narrowly related to maximal ventilatory capacity (maximal ventilation that the subject can perform for 20 seconds, expressed in L/min)
- Because it is a well defined and well used parameter, employed in large epidemiological studies, with good reproducibility.
- Because it can be measured with only one second of forced expiration after maximal inspiration, even if the subject stops the forced maneuver before reaching maximal expiration (sometimes the patient’s clinical status forces acceptance of minimal but useful information).
Now let us look at the classification of the ventilatory dysfunction vector according to the Functional Diagnosis (Table 1)
TABLE I: Characteristics of Ventilatory Dysfunction
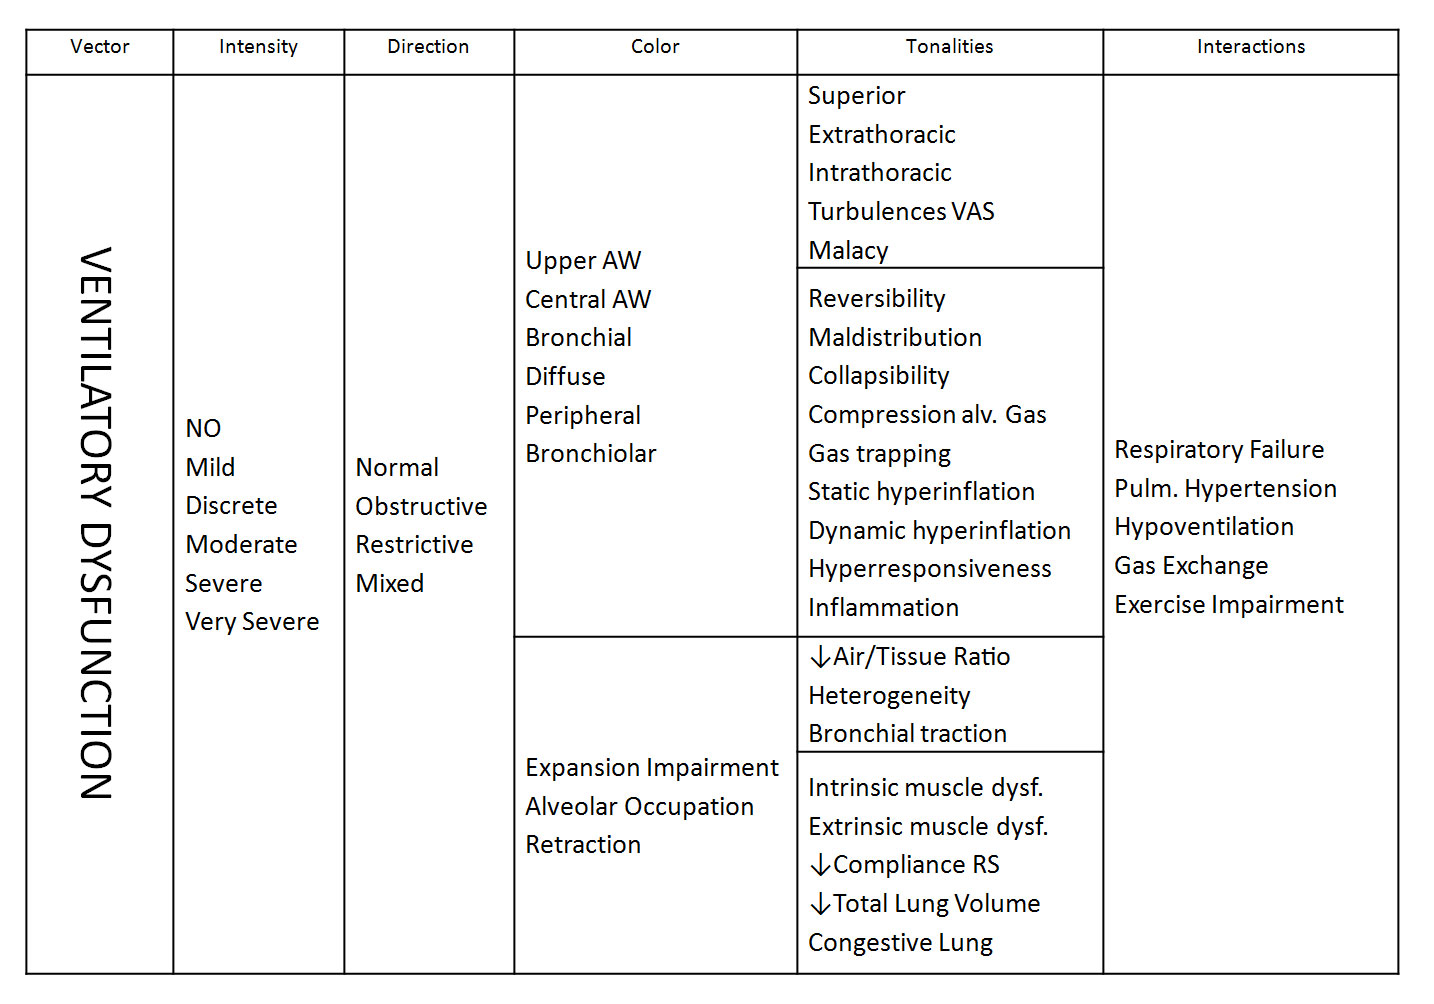
Spirometry can be used to identify the vector of ventilatory dysfunction (we will talk about exceptions later) and its intensity through the FEV1 parameter and its deviation from a normal or predicted value. Also, we can identify airways obstruction by a decrease in the FEV1%FVC ratio but, unless FVC falls inside a normal range, we will be unable to discard a concomitant restrictive disorder, as obstruction very often decreases FVC by gas trapping with expiratory maximal maneuver. Restrictive disorders can also be identified if FVC is decreased and FEV1%FVC is normal or above normal values.
To be more precise in the diagnosis of ventilatory dysfunction we will need other explorations, to provide information that adds Colors and Tonalities, and compose the complete picture of Ventilatory Dysfunction Functional Diagnosis. We can graphically represent the Vectorial Functional Diagnosis in the following figure:
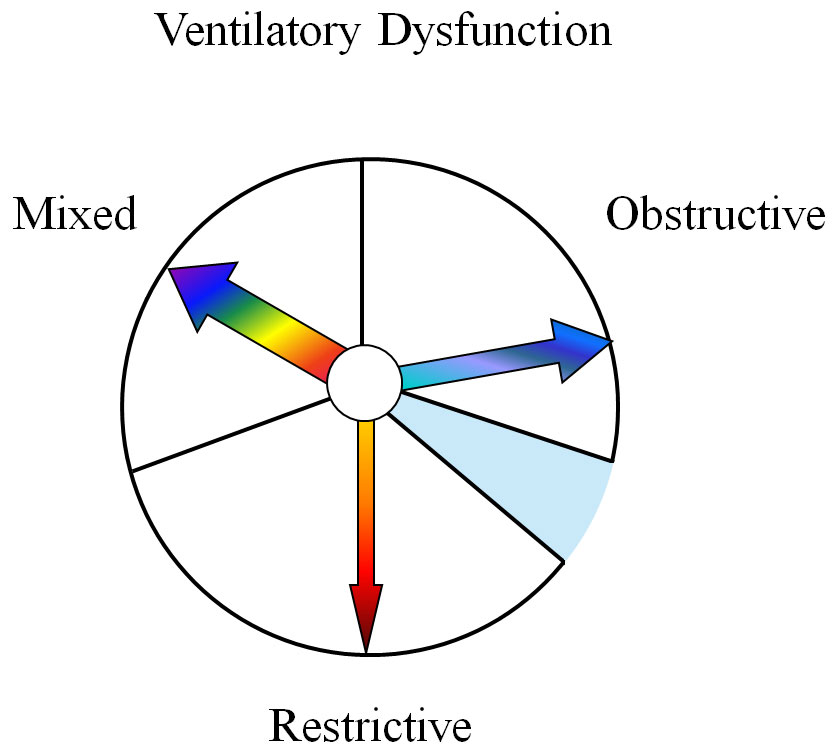
The circle, representing Ventilatory Dysfunction Diagnosis, is divided into three plus one sectors (the one filled in blue represents “no ventilatory dysfunction”). Vectors are situated in their sector according to the diagnosis, the further away from the mixed sector, the purer the obstructive or restrictive disorder (according to the available global information). The vector also has a size (thin or thick) according to the intensity of ventilatory dysfunction trouble (mild to very severe). Color characterizes the main quality of the disorder (see table) either obstructive or restrictive, (having a single tone) or a multicolored vector in the case of a mixed disorder. Finally, tonalities qualify ventilatory disorders, which complete the functional picture.
An example of this kind of functional diagnosis would be: “Moderate reduction of ventilatory ability because of an obstructive disorder involving preferentially small airways. Abrupt end of MEFV curve and the practical loss of expiratory reserve volume reflect peripheral airways closure during forced expiration, perhaps in relation to obesity. Increase of non mobilizable lung volume in absence of hyperinflation reflects dynamic alveolar gas trapping during forced expiration secondary to small airways disease, etc…” In this paragraph you have identified:
- A decrease in ventilatory capacity (Main Vector)
- It is moderate (Intensity)
- Caused by airways obstruction (Direction)
- Mainly of small airways (Color)
- Inducing airways closure, dynamic air trapping, etc… (Tonalities)
In successive articles, we will deal with different functional disturbances, with the help of real cases. But, first, I consider important to know how to obtain this information or, in other words, how to obtain the information from every functional test, beginning by spirometry and maximal flow volume curves. It is important to bear in mind that the functional impact of changes in a given parameter can be amplified or weakened by the redundant effect on other aspects of lung function (a mild “spirometric” obstruction becomes less “mild” if it induces substantial air trapping or hyperinflation for instance). In contrast with the classical method of functional diagnosis, reference values are only a reference, functional impacts are less related to the deviation from “normal” values than to the combined effects of different functional troubles.
It must also be remembered that we do not enter into technical aspects, only the functional diagnosis. We assume the functional exploration is reliable.


